Fluke 8050A Displays
Fluke 8050A Meter Displays
Here are some photos of typical meter displays on the modified Fluke 8050A multimeter with the graphical LCD replacement. Note that the basic functionality of the meter is not changed; it doesn't measure any more frequently, nor with any additional resolution or accuracy.
The fancy new display simply captures and manipulates whatever the Fluke 8050A was sending to it's 7-segment LCD display (and various annunciators). The new display also monitors the state of the various switches on the Fluke 8050A to discover the mode and scale the meter has been switched to, and uses that information to annotate the graphical display.
The new display controller also captures the digit values as they are displayed, and uses that for additional functionality (such as minimum and maximum values, a "bar graph" display, and the like.
Standard Display
Here's a "standard" display, with some annotations:
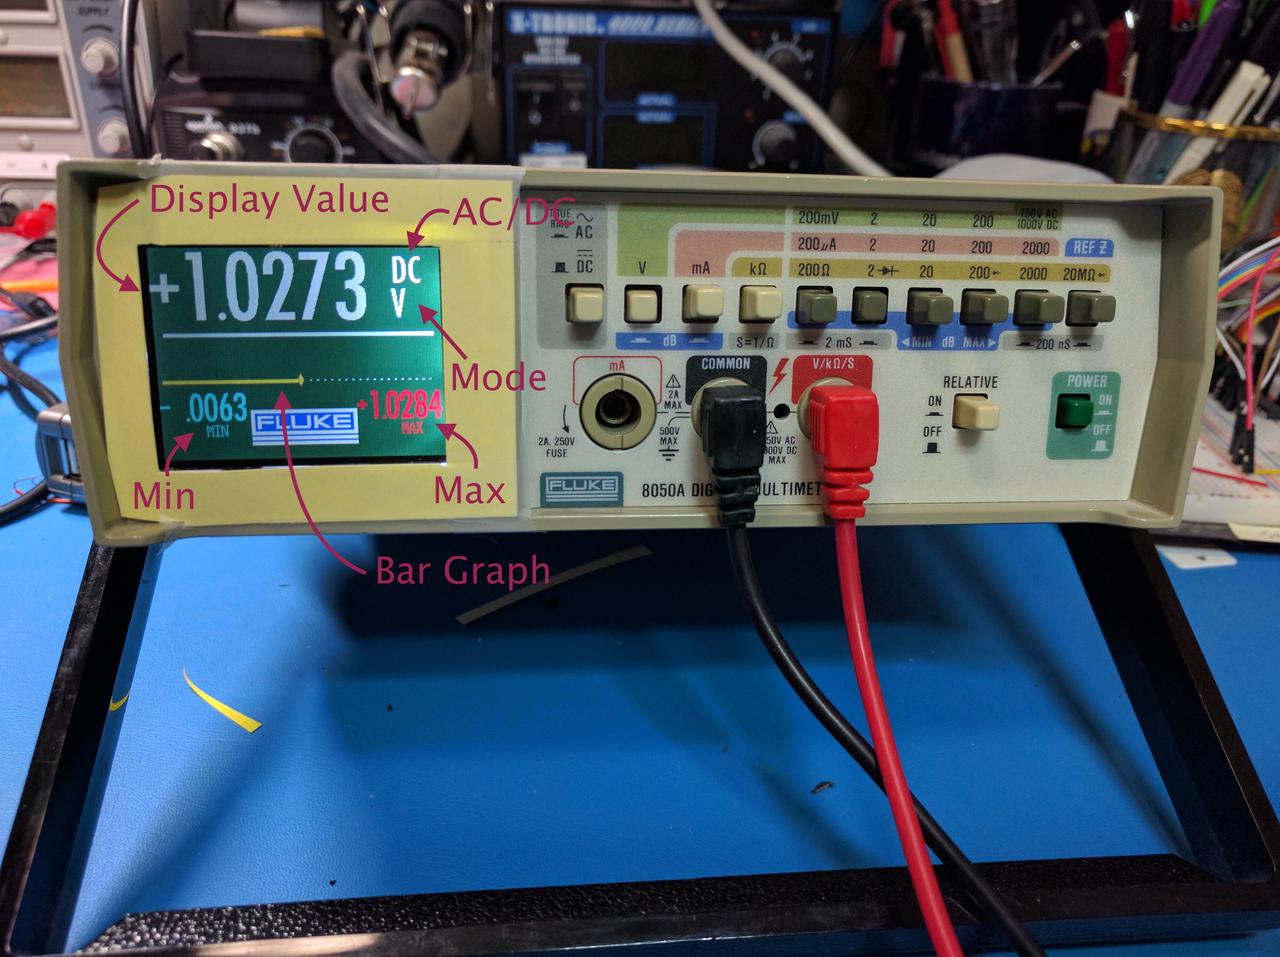
At the top of the display, in largest numbers is the value being measured by the multimeter. (Or perhaps the RELative offset, more on that later..) For modes that make sense, there's a leading sign to denote a positive or negative value. This sign would be present, for example, in DC measurement modes of voltage or amps where it makes sense.
As the Fluke 8050A is a 4½ digit multimeter, either 4 or 5 digits are displayed. The leading digit may be either blank or displayed as "1". Of course, the decimal point will change position according to the scale of the meter.
To the right of the measurement value, there is are two annunciators that will display "AC" or "DC" according the measurement being taken and based on the AC/DC switch position on the meter. In some measurement modes (such as Ohms), this annunciator will be blank.
Below that is an annunciator to show the current "mode" - Volts, Amps, Ohms, dB, or Siemens (conductance). These actually vary in color slightly to echo the color associated with the mode buttons on the Fluke 8050A meter. While this seemed like a great idea to me, in practice, it is difficult to notice the color difference. Having this be much more obvious makes the overall readability worse.
Just below the Display Value and AC/DC and Mode indicators is a separator line between the main display value and various auxiliary information also displayed. The line is an attempt to have the main display value, most commonly used, visually distinct from the rest of the display. This separator line also varies in color based on the measurement mode. The measurement line should also turn red if a high voltage is being measured (essentially, a way to indicate the "HV" annunciator on the original Fluke 8050A LCD display).
The area immediately below the separator line is normally blank; if the multimeter is in RELative mode, then this space is occupied with the measurement that the relative display value is relative to. An image will be presented below for that case.
Next is a Bar Graph display in yellow which traverses the width of the display. This is scaled to cover the magnitude (absolute value) of the Display Value from 0 to 20000 units. The thick part of the bar graph to a cursor displays the current value. As the Display Value varies, this bar graph and cursor will change, though the last 10 cursors will be displayed in successively dimmer shades of yellow to black. With a static measurement, only the last cursor will be seen.
Below the Bar Graph are the minimum (in blue) and maximum (in red) display values. These are updated upon each measurement the multimeter makes as the Display Value is updated. (This occurs every 410 milliseconds. See the Fluke 8050A Theory of Operation page.) The minimum and maximum values are reset whenever the measurement mode of the multimeter is changes, or the meter is switched in or out of RELative mode. When switching modes, the minimum and maximum values are not immediately updated until 2 or 3 measurements are taken in the new mode to ensure the meter has "settled down" and to avoid bogus displays due to contact bounce in the buttons, etc.
In between the min and max values is a Fluke logo to honor them for producing a meter which is still quite useful 30 years later.
Relative Display
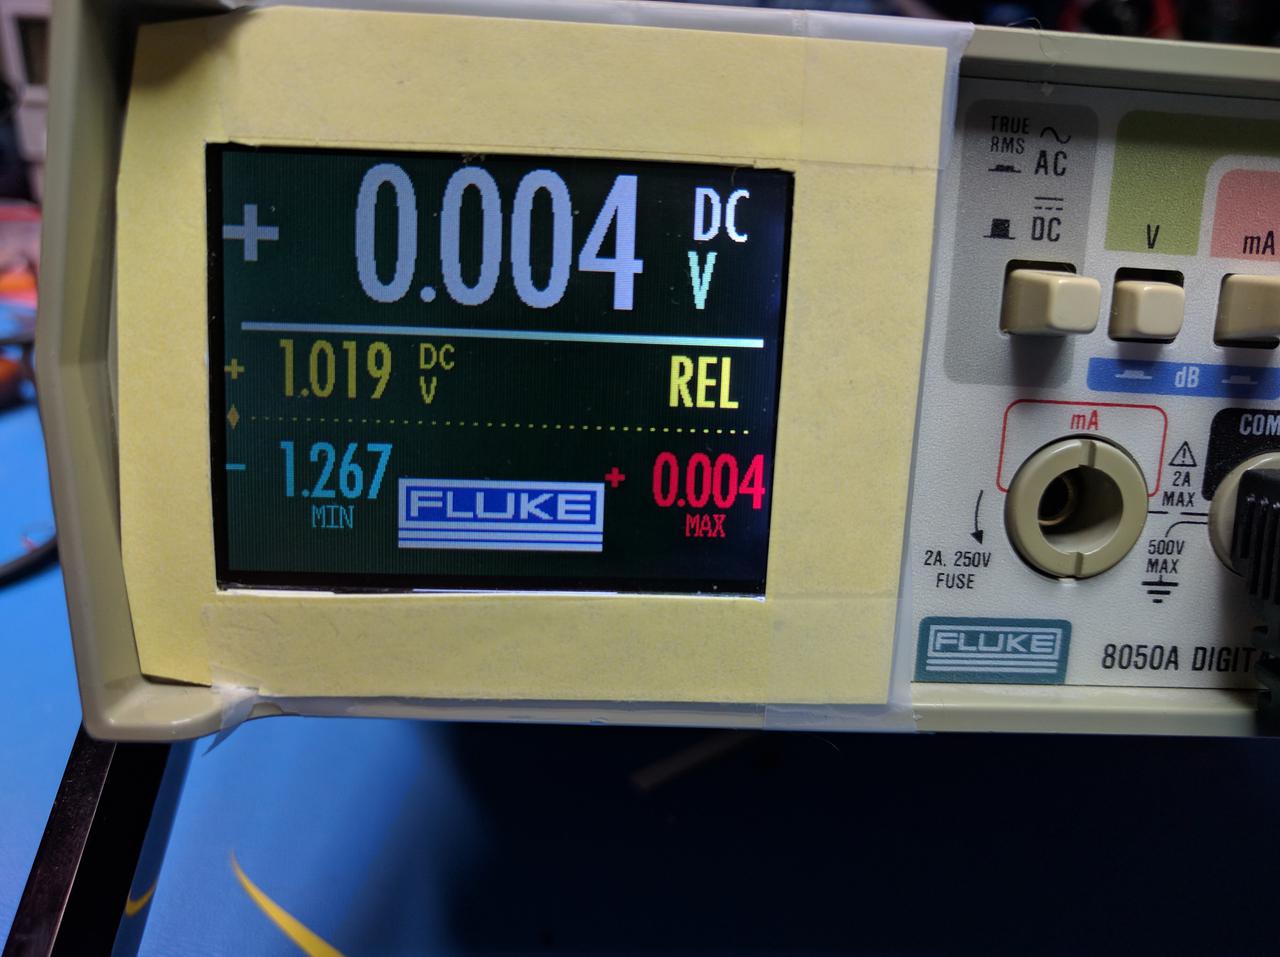
Here's a typical RELative display which occurs when the REL button on the multimeter is depressed. When this happens, the last non-relative Display Value captured is presented just below the separator line in smaller digits and in yellow, with smaller versions of the AC/DC and mode indicators. Also present at right hand edge of the line is a yellow "REL" indicator to denote that RELative mode is in effect.
While in RELative mode, the larger Display Value at the top is updated by the Fluke 8050A multimeter to show the offset of the current measurement. The Min and Max display values now will show the minimum and maximum values of this offset. Likewise, the Bar Graph display shows the magnitude (absolute value) of the RELative value being displayed. (It seems like it might be useful to scale this and have zero be in the middle of the bar graph, and positive and negative excursions got to the right and left, but this has not been implemented, and is left as an exercise to the reader.)
Comments